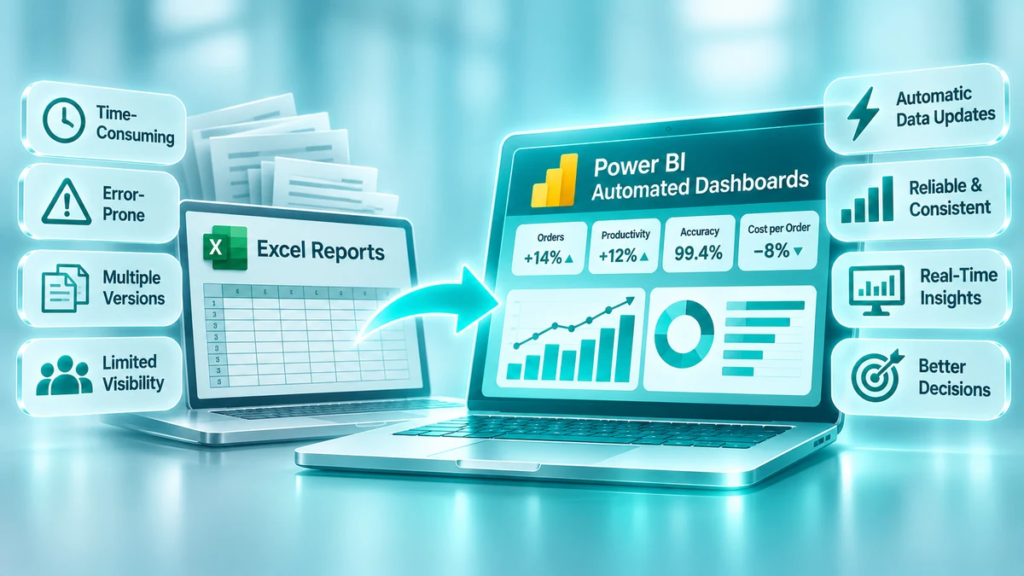
Excel is one of the most widely used tools in business reporting. It is flexible, familiar, and capable of handling a wide range of calculations and analyses. For many organisations, Excel spreadsheets are an essential part of daily operations.
However, as a business grows, reporting requirements become more complex. Data comes from more systems, management needs information more frequently, and employees spend increasing amounts of time collecting, checking, combining, and formatting spreadsheets.
At this point, manual Excel reporting can become a bottleneck.
Automated dashboards offer a more scalable way to manage business information. They connect data sources, refresh reports, visualise key performance indicators (KPIs), and give managers a consistent view of business performance.
The objective is not to eliminate Excel. It is to reduce repetitive reporting work and use the right tools for the right tasks.
In this article, we explore the limitations of manual Excel reporting, the benefits of automated dashboards, and how businesses can make the transition successfully.
1. Why Businesses Rely on Excel Reports
Excel remains a valuable business tool for several reasons:
- It is familiar to most office employees.
- It allows users to create calculations and customised reports.
- It is flexible when analysing small or medium-sized datasets.
- It supports quick ad hoc analysis.
- It is relatively easy to adapt to changing reporting needs.
For example, an operations manager may use Excel to track daily production output, employee working hours, warehouse productivity, or delivery performance.
In the early stages, this approach can work well. A small number of data sources and reports may be manageable with manual processes.
The challenge appears when reporting becomes a recurring business activity involving multiple departments, systems, and users.
2. The Hidden Costs of Manual Excel Reporting
Manual reporting often requires more effort than managers realise.
Employees may need to download data from different systems, copy information into templates, check formulas, update charts, and distribute files. The same process is then repeated daily, weekly, or monthly.
Several problems can develop.
Time-Consuming Data Preparation
Employees spend time collecting and preparing data instead of analysing results.
For example, a manager responsible for weekly operational reporting may need to:
- Export data from the ERP system.
- Download production or warehouse reports.
- Collect working-hour information.
- Combine the files.
- Check formulas and data consistency.
- Update charts and tables.
- Distribute the report.
When repeated across several departments, this can consume a significant amount of working time.
Multiple Versions of the Same Report
When reports are distributed as separate files, different employees may save and modify their own copies.
This creates questions such as:
- Which file contains the latest figures?
- Has everyone used the same data?
- Were formulas changed?
- Are managers reviewing identical KPI definitions?
Without a controlled reporting process, different versions can lead to inconsistent decisions.
Errors and Inconsistent Calculations
Manual copy-and-paste activities, overwritten formulas, incorrect filters, and outdated source files can affect report accuracy.
Even a small error in a frequently used KPI can influence management decisions.
Delayed Information
If reports are prepared manually once a week or once a month, managers may be working with information that is already outdated.
Problems can develop between reporting periods without being visible to decision-makers.
Limited Analysis
A static Excel report may show what happened, but investigating why it happened can require additional filters, formulas, pivot tables, and manual comparisons.
As the volume of data grows, this analysis becomes increasingly difficult to maintain.
3. What Is an Automated Dashboard?
An automated dashboard is a reporting environment that connects to defined data sources, processes information according to agreed rules, and presents results through visual reports.
Tools such as Microsoft Power BI can connect to multiple systems and combine their data into a central reporting model.
A typical automated reporting process looks like this:
- Data is collected from source systems.
- The data is cleaned and transformed.
- Business rules and KPI calculations are applied.
- The dashboard is refreshed according to a defined schedule or connection method.
- Users access the latest successfully refreshed information.
Instead of manually rebuilding reports, employees can use a shared dashboard to review performance.
Automated does not always mean real-time. The refresh frequency depends on the data source, technical setup, licences, and business requirements. For many management reports, scheduled daily or several-times-per-day refreshes are sufficient.
4. Excel Reports vs Automated Dashboards
Both Excel and automated dashboards have their place. The right choice depends on the purpose, complexity, and frequency of the reporting task.
| Area | Manual Excel reporting | Automated dashboards |
|---|---|---|
| Data preparation | Often manual | Can be automated |
| Report updates | Employees update files | Refreshes through configured connections |
| Data consistency | Depends on file management | Centralised definitions and data model |
| Reporting frequency | Limited by preparation time | Can support frequent scheduled refreshes |
| Visualisation | Charts and tables | Interactive dashboards |
| Analysis | Often requires manual work | Filters, drill-downs, and cross-analysis |
| Distribution | Files and email attachments | Shared access with permissions |
| Scalability | Can become difficult to maintain | Better suited to repeatable, growing reporting needs |
| Flexibility | Excellent for ad hoc analysis | Best for structured, recurring reporting |
The main advantage of dashboards is not that they replace every spreadsheet. It is that they make recurring reporting more consistent, accessible, and efficient.
5. The Business Benefits of Automated Dashboards
Moving from manual reports to automated dashboards can create value across several areas.
Reduced Reporting Workload
Automating data collection, transformation, and calculations reduces repetitive tasks.
Employees can spend less time preparing reports and more time understanding results, investigating problems, and supporting improvements.
One Consistent View of Performance
A centralised reporting model helps departments work with the same KPI definitions and agreed data sources.
For example, if labour productivity is calculated consistently across all departments, management can compare performance more reliably.
Faster Access to Information
Managers no longer need to wait for someone to prepare and distribute a report before reviewing performance.
They can access the dashboard when needed, subject to the configured refresh schedule and access permissions.
Better Decision-Making
Interactive dashboards allow users to explore results by department, period, product, shift, customer, or process.
This makes it easier to identify patterns and investigate deviations.
Improved Accountability
When targets, actual results, and trends are visible, it becomes easier to identify areas requiring attention and agree on improvement actions.
Dashboards can support regular management reviews by providing a shared factual basis for discussion.
Greater Reporting Scalability
As the organisation grows, reporting needs usually expand.
A well-designed data model and automated reporting process can support additional departments, KPIs, and data sources without rebuilding every report manually.
6. What Should Businesses Automate First?
Not every spreadsheet should become a dashboard. The best starting point is recurring reporting that consumes significant time or supports important management decisions.
Consider prioritising reports that meet several of these criteria:
- Prepared regularly, such as daily, weekly, or monthly.
- Require data from multiple systems.
- Involve repetitive copy-and-paste activities.
- Contain important business KPIs.
- Are used by several managers or departments.
- Require frequent comparisons with targets or previous periods.
- Are difficult to maintain or prone to errors.
Examples of reporting areas that often benefit from automation include:
| Business area | Example dashboard information |
|---|---|
| Operations | Output, productivity, downtime, efficiency |
| Warehouse | Picking productivity, accuracy, labour utilisation, dispatch |
| Finance | Revenue, costs, margins, budget variances |
| Sales | Sales performance, pipeline, conversion, revenue |
| HR | Headcount, absence, turnover, working hours |
| Management | Strategic KPIs, targets, trends, business performance |
A good starting project is usually one important report with a clear business purpose, rather than attempting to automate every spreadsheet at once.
7. How to Transition from Excel to Power BI Dashboards
A successful transition requires more than transferring charts from Excel into Power BI. It involves reviewing the reporting process and establishing a reliable data foundation.
Step 1: Review Existing Reports
List the reports currently prepared across the business.
For each report, identify:
- Who prepares it?
- How often is it updated?
- Which systems provide the data?
- Which KPIs does it contain?
- Who uses it?
- What decisions does it support?
- How much time does preparation require?
This helps identify duplicated reporting, unnecessary metrics, and opportunities for automation.
Step 2: Standardise KPI Definitions
Before building dashboards, agree on how each KPI is calculated.
For example, employee productivity may be measured using total paid hours in one department and productive hours in another.
If these definitions are not aligned, the dashboard may simply make inconsistent information look more professional.
Document the calculation, data source, reporting frequency, target, and responsible owner for each important KPI.
Step 3: Check Data Quality and Availability
Identify where the required data is stored and whether it can be accessed reliably.
Check for:
- Missing or duplicated records.
- Inconsistent dates and identifiers.
- Incorrect or incomplete values.
- Different naming conventions.
- Unclear ownership of source data.
A dashboard cannot compensate for unreliable source information.
Step 4: Build the Data Model
Connect the relevant sources and create a structured data model.
This may involve combining ERP data, operational records, Excel files, and other business systems.
The model should support consistent KPI calculations and allow users to analyse performance across relevant dimensions.
Step 5: Design Dashboards Around Users
Different users need different levels of detail.
Senior management may need a high-level overview of business performance, while department managers need operational detail.
A useful dashboard should make the most important information easy to find and avoid unnecessary visual complexity.
Step 6: Validate the Results
Compare dashboard figures with existing reports and source systems.
Check that:
- KPI calculations are correct.
- Filters work as expected.
- Reporting periods are consistent.
- Refresh processes operate correctly.
- Users see only the data they are authorised to access.
Do not replace an established management report until the new solution has been tested and accepted.
Step 7: Introduce and Maintain the New Reporting Process
Explain how employees should use the dashboards and where they can find KPI definitions.
Assign responsibility for data quality, report ownership, access permissions, and technical maintenance.
Review the dashboards periodically to ensure that they remain relevant as business needs change.
8. Example: Calculating the Value of Reporting Automation
Consider a business that prepares 12 recurring reports every week.
Each report takes an average of 45 minutes to collect data, update formulas, check results, and distribute.
Current manual workload:
12 reports × 45 minutes = 9 hours per week.
If automation reduces preparation and checking time to 15 minutes per report:
12 reports × 15 minutes = 3 hours per week.
Potential time released:
9 − 3 = 6 hours per week.
Across 48 working weeks, this represents:
6 × 48 = 288 hours per year.
This is an illustrative calculation, not a guaranteed saving. Actual results depend on data quality, integration complexity, report design, refresh requirements, and ongoing maintenance.
The released time can be redirected towards performance analysis, problem-solving, and improvement activities.
9. Common Mistakes to Avoid
Businesses can fail to get the expected value from dashboard automation if they focus only on the technology.
Avoid these common mistakes:
Automating inefficient reports
If a report contains unnecessary KPIs or duplicated information, automating it will not improve its business value. Simplify the reporting process first.
Ignoring data quality
Poor source data produces unreliable dashboard results. Data validation should be part of the solution from the beginning.
Creating too many dashboards
More dashboards do not necessarily mean better management. Prioritise the information that supports important decisions.
Failing to involve users
Managers and employees should help define what information they need and how they will use it.
Treating dashboards as a replacement for management
Dashboards show performance, but they do not replace operational knowledge, problem-solving, or management responsibility.
Ignoring maintenance
Data connections, access permissions, KPI definitions, and refresh processes need ongoing ownership.
Conclusion: Move from Preparing Reports to Improving Performance
Excel remains a useful tool for calculations, ad hoc analysis, and flexible data work. However, relying entirely on manual spreadsheets for recurring business reporting can limit visibility, consistency, and the speed of decision-making.
Automated dashboards help businesses create a more structured reporting environment. They reduce repetitive preparation work, improve access to performance information, and make it easier to analyse KPIs across departments and processes.
The most important part of the transition is not the technology itself. It is defining what the business needs to measure, ensuring the data is reliable, and connecting reporting with management decisions.
The goal is simple: spend less time preparing reports and more time improving business performance.
How TOP KPI Can Help
TOP KPI helps organisations move towards structured, data-driven performance management.
Our services include:
- AUDIT – identify operational inefficiencies and performance gaps.
- DATA – structure operational data and establish reliable performance measurement.
- POWER BI – develop dashboards that make KPIs and operational results visible.
- ADVISORY – support management teams with performance reviews and improvement decisions.
- IMPLEMENTATION – turn analysis into practical operational improvements.
Explore our DATA services and POWER BI solutions to find out how automated reporting can support your business.