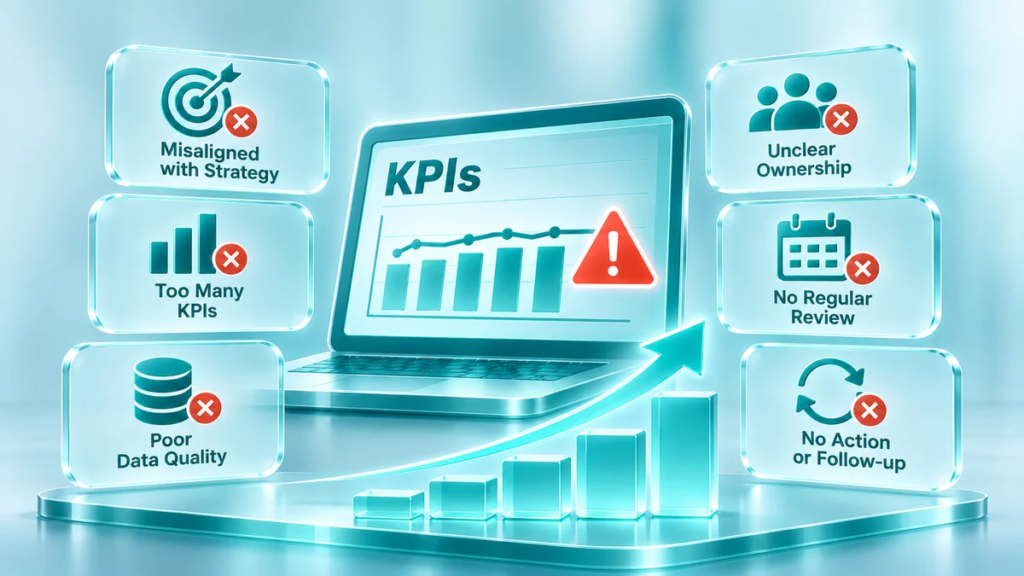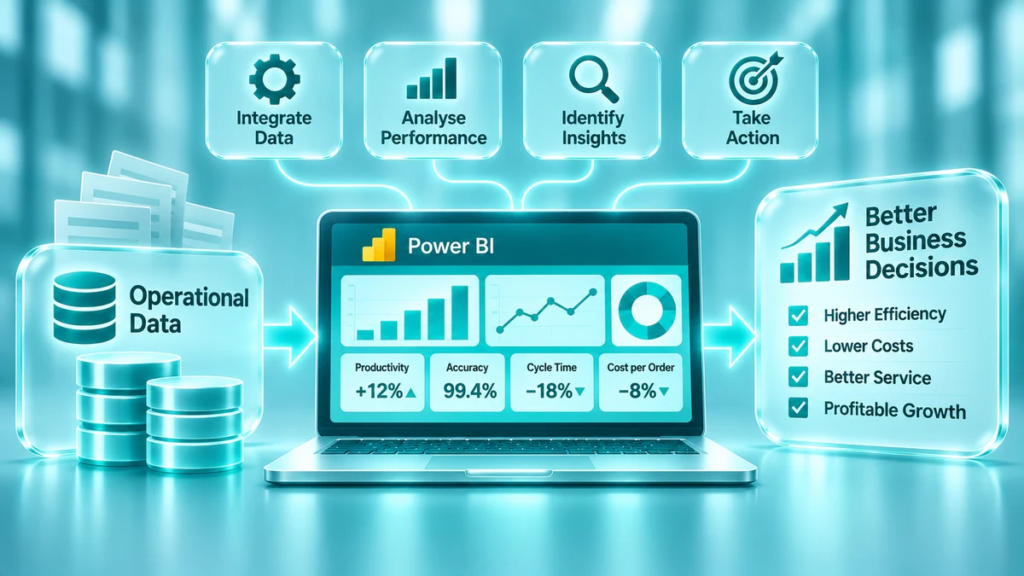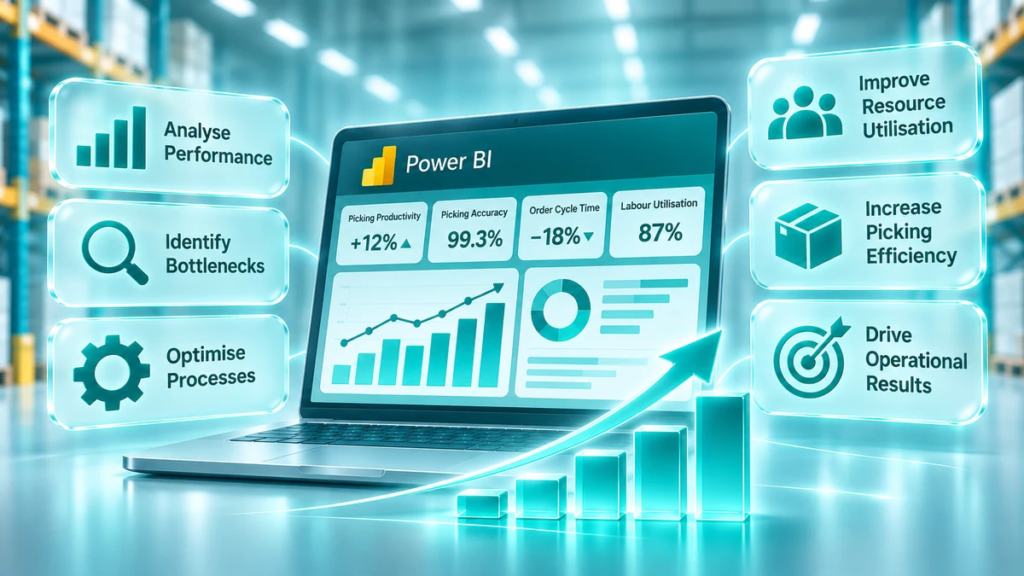
Warehouses generate large amounts of operational data every day. Every order picked, item moved, delivery received, and hour worked creates information that can help managers understand how the operation is performing.
However, collecting data is not the same as using it effectively. Many warehouses track dozens of figures but still struggle to identify why productivity is declining, where costs are increasing, or which processes need improvement.
Data analytics helps turn operational data into practical management decisions. By combining information from warehouse management systems (WMS), labour records, inventory systems, and operational reports, managers can identify inefficiencies, monitor performance, and make better decisions.
In this article, we explain how to use data analytics to improve warehouse performance and build a more effective, data-driven operation.
1. Start with the Warehouse Performance Objectives
Before analysing data, define what you want to improve.
A warehouse may have several priorities:
- Increase picking productivity.
- Improve order accuracy.
- Reduce operating costs.
- Improve on-time dispatch performance.
- Increase labour utilisation.
- Reduce unnecessary movement and handling.
- Improve inventory accuracy.
These objectives should guide the selection of data and KPIs. Otherwise, managers risk creating reports that contain large amounts of information but do not support decisions.
For example, if the main objective is to improve picking productivity, relevant measures may include:
- Order lines picked per labour hour.
- Picking time per order.
- Travel time as a percentage of total picking time.
- Picking error rate.
- Labour hours per completed order.
The important principle is to connect every analytical activity to a measurable operational objective.
2. Bring Data from Different Sources Together
Warehouse performance information is often spread across several systems.
Common data sources include:
| Data source | Information available |
|---|---|
| Warehouse Management System (WMS) | Orders, picking activity, inventory movements, order status |
| ERP system | Costs, purchasing, sales, stock value |
| Labour management records | Working hours, attendance, overtime, employee allocation |
| Transport systems | Dispatch times, delivery performance, transport costs |
| Quality records | Picking errors, damages, returns, complaints |
| Operational spreadsheets | Shift reports, manual counts, improvement actions |
When these sources are analysed separately, it can be difficult to understand the full picture.
For example, a WMS report may show that picking productivity has declined. Labour records may reveal that the warehouse has experienced more overtime, while order data may show a higher proportion of small orders requiring more handling.
Combining these datasets helps managers understand the reasons behind performance changes.
A practical first step is to identify which systems contain the required information, check data quality, and establish consistent definitions for key measures.
3. Select the Right Warehouse KPIs
Not every available data point should become a KPI. The best performance indicators provide clear information about productivity, quality, service, and cost.
The following KPIs are useful starting points for warehouse analytics:
| KPI | Calculation | What it helps measure |
|---|---|---|
| Picking productivity | Order lines picked ÷ picking labour hours | Picking efficiency |
| Labour productivity | Completed tasks ÷ labour hours | Workforce output |
| Picking accuracy | Correct order lines ÷ total order lines × 100 | Picking quality |
| On-time dispatch | Orders dispatched on time ÷ total orders × 100 | Service performance |
| Order cycle time | Order completion time − order release time | Process speed |
| Labour cost per order | Total warehouse labour cost ÷ orders processed | Labour cost efficiency |
| Inventory accuracy | Accurate stock records ÷ records checked × 100 | Inventory reliability |
| Overtime percentage | Overtime hours ÷ total labour hours × 100 | Workforce planning |
The selection should reflect the warehouse’s operational priorities. In many cases, starting with five to eight well-defined KPIs is more effective than monitoring dozens of indicators without clear ownership.
For more examples, see our article on 10 Warehouse KPIs Every Operations Manager Should Track.
4. Analyse Trends Instead of Looking at Isolated Results
A single day’s result rarely explains the real performance of a warehouse.
Data analytics becomes more valuable when managers compare results over time and look for patterns.
Useful comparisons include:
- Daily and weekly productivity trends.
- Performance by shift.
- Performance by warehouse zone.
- Results by order type.
- Labour productivity by process.
- Overtime trends by department.
- Picking accuracy across different product categories.
For example, overall picking productivity may appear stable. However, a more detailed analysis could reveal that one warehouse zone has improved while another has experienced a significant decline.
This helps managers avoid treating the entire operation as one uniform process.
It is also important to account for differences in workload. Comparing shifts without considering order volumes, product characteristics, or task complexity can lead to misleading conclusions.
5. Identify the Root Causes Behind Performance Problems
Analytics should not stop at showing that a KPI is below target. The next step is to understand why.
Consider a warehouse where picking productivity has fallen by 12% over four weeks.
Possible explanations might include:
- Increased travel distances due to changes in product locations.
- More small orders and fragmented picking activity.
- Insufficient staffing during peak periods.
- Higher employee absence.
- Delays caused by replenishment shortages.
- Equipment availability problems.
- An increase in manual handling or additional checks.
Instead of immediately asking employees to work faster, managers should investigate the process.
A useful approach is to combine KPI analysis with operational observations, employee feedback, and root cause analysis techniques such as the 5 Whys.
For example:
Problem: Picking productivity has decreased.
Observation: Employees spend more time travelling between locations.
Further analysis: High-volume products are not positioned close to the main picking routes.
Root cause: Storage locations have not been reviewed following changes in demand.
Potential action: Review product slotting and relocate frequently picked items.
This is where data analytics becomes a practical improvement tool rather than simply a reporting activity.
6. Use Power BI to Make Warehouse Performance Visible
When warehouse data is stored in multiple systems or spreadsheets, managers may spend too much time preparing reports manually.
Power BI can help consolidate this information into interactive dashboards that provide a consistent view of operational performance.
A well-designed warehouse dashboard could include:
Management overview
- Total orders processed.
- Overall warehouse productivity.
- Labour cost per order.
- On-time dispatch performance.
- Current performance against targets.
Picking performance
- Order lines picked per labour hour.
- Picking accuracy.
- Productivity by shift and warehouse zone.
- Picking trends over time.
Workforce performance
- Planned versus actual labour hours.
- Overtime.
- Absence.
- Labour utilisation.
- Productivity by process.
Operational efficiency
- Order cycle time.
- Replenishment delays.
- Equipment utilisation.
- Inventory accuracy.
Power BI also allows managers to filter results by date, shift, process, department, or warehouse area.
This makes it easier to move from a high-level performance overview to the operational details behind a problem.
However, a dashboard should not become an end in itself. It must present relevant information clearly and help managers decide what action to take.
7. Turn Analytical Insights into Improvement Actions
The real value of warehouse analytics comes from the improvements it enables.
When an issue is identified, it should be translated into a specific action with a responsible owner and a deadline.
A simple improvement action log can help:
| Performance issue | Improvement action | Responsible person | Success measure |
|---|---|---|---|
| Low picking productivity | Review product locations and picking routes | Warehouse Manager | Order lines per labour hour |
| High overtime | Improve workforce planning | Operations Manager | Overtime percentage |
| Picking errors | Review process standards and employee training | Team Leader | Picking accuracy |
| Dispatch delays | Analyse order cut-off and staging processes | Dispatch Manager | On-time dispatch |
| Low labour utilisation | Review workload allocation between processes | Operations Manager | Productive hours percentage |
Performance should then be reviewed to establish whether the action has produced the expected result.
If performance does not improve, the original assumption should be reconsidered and further analysis carried out.
This creates a continuous improvement cycle:
- Measure current performance.
- Identify a deviation or opportunity.
- Analyse the underlying cause.
- Define and implement an action.
- Measure the impact.
- Standardise successful improvements.
8. Example: Turning Warehouse Data into Measurable Results
Consider a warehouse employing 20 picking employees who work eight hours per day.
Current performance:
- Employees: 20
- Working hours per employee: 8
- Total picking labour hours: 160
- Daily picking output: 16,000 order lines
- Picking productivity: 100 order lines per labour hour
After analysing picking data, the management team identifies excessive travel distances and inefficient product locations as improvement opportunities.
Following a slotting review and changes to picking routes, productivity increases by 10%.
| Measure | Before | After |
|---|---|---|
| Picking labour hours | 160 | 160 |
| Order lines picked | 16,000 | 17,600 |
| Lines per labour hour | 100 | 110 |
The warehouse can now process 1,600 additional order lines per day with the same number of labour hours.
This is an illustrative example, not a guaranteed result. Actual improvements depend on the warehouse layout, order profile, workforce, systems, and implementation quality.
The example demonstrates how operational data can help identify improvement opportunities and measure the impact of changes.
9. Build a Consistent Data-Driven Management Routine
Warehouse analytics should be part of everyday management, not an activity performed only when problems become serious.
A practical review structure can operate at three levels:
Daily operational review
Focus on yesterday’s performance, current workload, staffing, service issues, and immediate corrective actions.
Weekly performance review
Analyse KPI trends, recurring problems, productivity differences between shifts, and progress against improvement actions.
Monthly management review
Evaluate operating costs, capacity, workforce utilisation, service performance, and progress towards strategic objectives.
Each review should answer three questions:
- What is happening?
- Why is it happening?
- What are we going to do about it?
This structure helps ensure that data is consistently translated into decisions and actions.
Conclusion: Make Warehouse Data Work for Your Business
Warehouse data has limited value if it is only collected and reported. Its real potential lies in helping managers understand operational performance, identify inefficiencies, and make better decisions.
An effective approach starts with clear objectives, reliable data, relevant KPIs, and meaningful analysis. Power BI can then make performance information more accessible, while structured management routines ensure that insights lead to measurable improvements.
The goal is not to create more reports. It is to build a warehouse operation where decisions are based on facts, problems are identified early, and improvement actions are measured.
How TOP KPI Can Help
TOP KPI helps businesses improve operational performance through structured analysis, data management, and practical implementation.
Our services include:
- AUDIT – identify operational inefficiencies and performance gaps.
- DATA – structure operational data and establish reliable performance measurement.
- POWER BI – develop dashboards that make KPIs and operational results visible.
- ADVISORY – support management teams with performance reviews and improvement decisions.
- IMPLEMENTATION – turn analysis into practical operational improvements.
If you want to understand what your warehouse data is telling you and how to use it to improve results, explore our DATA and POWER BI solutions.