Every business generates operational data. Sales transactions, production output, warehouse activity, delivery performance, employee working hours, customer service records, and operating costs all provide information about how an organisation performs.
Yet having data does not automatically lead to better decisions.
Many businesses collect large amounts of information but struggle to turn it into practical management action. Reports are prepared, KPIs are reviewed, and dashboards are updated, but the same operational problems continue.
The real value of data comes when it helps managers understand what is happening, identify why it is happening, and decide what should be done next.
This requires more than reporting. It requires a structured approach that connects operational data with business objectives, management decisions, and measurable results.
In this article, we explain how to turn operational data into better business decisions and build a more effective data-driven management process.
1. Start with a Business Question, Not a Report
One of the most common mistakes in business analytics is starting with the available data rather than the decision that needs to be made.
A business may have hundreds of reports and dozens of dashboards, but not all of them provide information that supports meaningful action.
Instead of asking, “What data can we report?”, managers should ask:
- Why are operating costs increasing?
- Which processes are limiting productivity?
- Why are customer deliveries late?
- Are we using our workforce efficiently?
- Which products or customers generate the strongest margins?
- Where should we invest resources to improve performance?
These questions establish the purpose of the analysis.
For example, if the objective is to reduce warehouse operating costs, relevant information may include labour hours, order volumes, overtime, picking productivity, equipment utilisation, and error rates.
The analysis should focus on information that helps answer the business question.
Practical principle: Every important report should support a decision, a performance review, or a clearly defined management responsibility.
2. Collect Data That Reflects Business Performance
Operational data is usually spread across different systems and departments.
Common sources include:
| Data source | Example information |
|---|---|
| ERP systems | Sales, purchasing, costs, inventory |
| WMS | Warehouse transactions, picking, stock movements |
| Production systems | Output, downtime, defects, production hours |
| HR systems | Working hours, absence, employee information |
| CRM systems | Customers, sales pipeline, customer activity |
| Finance systems | Revenue, margins, budgets, operating costs |
| Excel reports | Targets, operational records, manual calculations |
The challenge is not simply connecting these sources. The information must also be reliable and consistent.
Before using data for management decisions, check:
- Whether records are complete and up to date.
- Whether different systems use consistent identifiers.
- Whether duplicate or incorrect records exist.
- Whether dates, units, and categories are defined consistently.
- Whether the source of each important KPI is clear.
- Who is responsible for data quality.
For example, if two departments calculate labour productivity using different definitions of working hours, their results cannot be compared reliably.
A consistent data foundation is essential for meaningful analysis.
3. Convert Raw Data into Meaningful KPIs
Raw data describes individual transactions or events. KPIs summarise performance in a way that helps managers understand results.
The right KPIs connect operational activity with business objectives.
Consider the following examples:
| Business objective | KPI | What the KPI helps managers understand |
|---|---|---|
| Improve productivity | Output per labour hour | How efficiently labour resources are used |
| Reduce operating costs | Cost per unit | How much it costs to deliver a unit of output |
| Improve quality | First-time-right rate | How often work is completed without errors |
| Improve customer service | On-time delivery | Whether customer commitments are met |
| Improve workforce planning | Overtime percentage | Whether workload and staffing are balanced |
| Improve profitability | Gross margin | How much revenue remains after direct costs |
| Improve inventory management | Inventory accuracy | How reliable stock records are |
A useful KPI should have:
- A clear business purpose.
- A precise calculation formula.
- A reliable data source.
- A defined target or comparison point.
- A responsible owner.
- A regular review frequency.
Avoid measuring everything. A focused set of relevant KPIs is usually more useful than a large collection of indicators without clear ownership.
4. Compare Actual Performance with Targets
A KPI value on its own does not always tell managers whether performance is good or poor.
For example, producing 500 units per day may be excellent for one production line and insufficient for another.
Performance needs context.
Useful comparisons include:
- Actual results versus targets.
- Current results versus previous periods.
- Performance between departments or teams.
- Actual costs versus budget.
- Productivity across shifts or locations.
- Results before and after an improvement initiative.
Consider a simple example:
| KPI | Target | Actual | Variance |
|---|---|---|---|
| Production output per hour | 100 units | 92 units | -8% |
| First-time-right rate | 98% | 96% | -2 percentage points |
| On-time delivery | 95% | 91% | -4 percentage points |
These results highlight three areas requiring attention.
However, the figures do not yet explain why performance is below target. They indicate where managers should investigate.
It is also important to distinguish between percentage change and percentage-point differences. For example, a fall from 98% to 96% is a decrease of 2 percentage points, not 2%.
5. Analyse the Reasons Behind the Results
The most important step in data-driven decision-making is moving beyond the KPI result to understand its underlying causes.
A dashboard may show that productivity has declined, but the cause could be very different depending on the process.
Possible factors include:
- Changes in workload or demand.
- Equipment downtime.
- Inefficient work organisation.
- Employee absence or skills gaps.
- Material shortages.
- Poor process standards.
- Increased product or order complexity.
- Delays between operational activities.
A structured root cause analysis can help distinguish symptoms from actual problems.
For example:
Business observation: Production output per labour hour has fallen by 8%.
Further analysis: The decline is concentrated on one production line and one shift.
Operational investigation: Employees experience repeated waiting time due to delayed material replenishment.
Root cause: Replenishment activities are not aligned with the production schedule.
Management decision: Review replenishment planning and introduce clearer responsibility for material availability.
This approach prevents managers from reacting to a KPI without understanding what is driving it.
Useful techniques include:
- 5 Whys analysis.
- Fishbone diagrams.
- Pareto analysis.
- Process mapping.
- Trend and variance analysis.
- Direct observation of operational activities.
Data helps identify where to investigate. Operational knowledge helps explain what is happening.
6. Use Power BI to Make Business Performance Visible
When information is spread across different systems and spreadsheets, it can be difficult for managers to see the full picture.
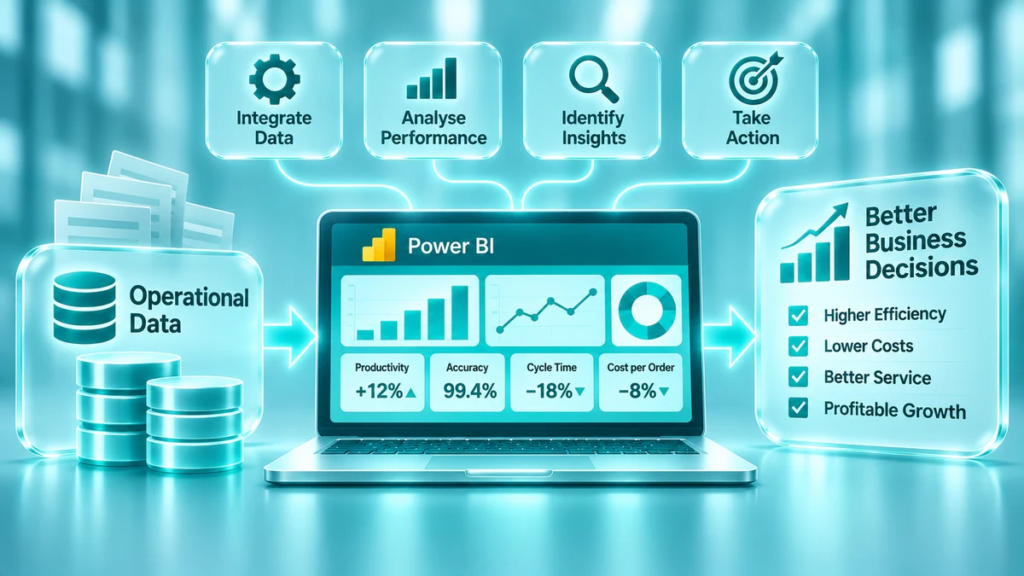
Power BI helps combine data into interactive dashboards and reports.
A well-designed dashboard can show:
Management overview
- Revenue and operating costs.
- Productivity and efficiency.
- Service performance.
- Quality indicators.
- Performance against business targets.
Operational performance
- Output by process or department.
- Labour productivity.
- Downtime and delays.
- Error rates.
- Resource utilisation.
Financial performance
- Actual costs versus budget.
- Cost per unit.
- Gross margin.
- Department-level performance.
Workforce performance
- Working hours.
- Overtime.
- Absence.
- Productivity.
- Labour allocation.
Managers can use filters and drill-down analysis to investigate results by period, location, department, product, or process.
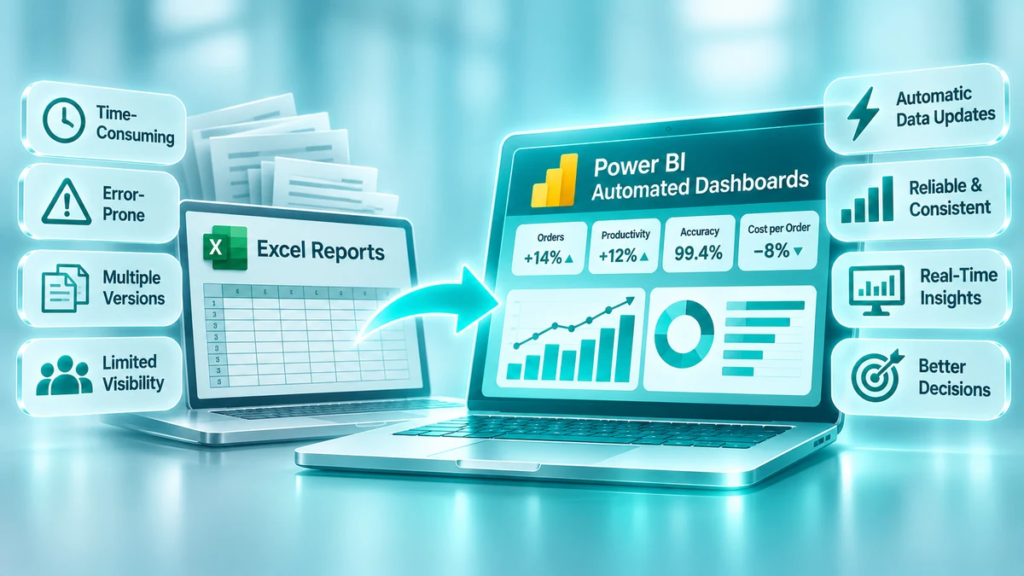
Power BI can also reduce manual reporting work by connecting to business data sources and refreshing reports according to a configured schedule.
However, a dashboard should not simply display more information. It should make important performance issues easier to identify and understand.
7. Turn Insights into Specific Management Decisions
An analytical finding only creates value when it leads to an appropriate decision.
For each significant performance issue, managers should define:
- What needs to change?
- Why is the change necessary?
- What action will be taken?
- Who is responsible?
- When should it be completed?
- How will success be measured?
A practical decision and action table can look like this:
| Data insight | Management decision | Action | Success measure |
|---|---|---|---|
| High overtime in one department | Improve workforce planning | Adjust shift allocation | Overtime percentage |
| Increasing cost per unit | Review process efficiency | Analyse material and labour losses | Cost per unit |
| Declining on-time delivery | Improve order planning | Review scheduling and dispatch processes | On-time delivery |
| High error rate | Strengthen quality control | Analyse error causes and update standards | First-time-right rate |
| Low equipment utilisation | Improve capacity planning | Review equipment allocation and downtime | Equipment utilisation |
The decision should address the identified cause, not simply the visible symptom.
For example, if overtime is increasing because of poor workload planning, asking employees to work faster may not solve the problem. Better scheduling or resource allocation may be more effective.
8. Measure Whether the Decision Improved Performance
Making a decision is not the end of the process.
Managers need to verify whether the action produced the expected result.
A simple improvement cycle can help:
- Establish the baseline performance.
- Identify the problem and its root cause.
- Agree on the improvement action.
- Assign responsibility and a deadline.
- Implement the change.
- Compare the new results with the baseline.
- Standardise the improvement if it is successful.
For example, a business may introduce a new production planning process to reduce waiting time.
Before implementation, average waiting time is 45 minutes per shift. After four weeks, it falls to 30 minutes.
This represents a reduction of 15 minutes per shift, or approximately 33%.
The business should also check whether the change has affected other measures, such as output, quality, overtime, and delivery performance.
This prevents an apparent improvement in one KPI from creating problems elsewhere.
9. Build a Management Routine Around Data
Data-driven decision-making should be part of everyday management, not an occasional analytical exercise.
A structured review routine helps ensure that information is discussed and acted upon.
| Review frequency | Main focus | Typical decisions |
|---|---|---|
| Daily | Operational performance and deviations | Immediate corrective actions |
| Weekly | KPI trends and recurring issues | Process and resource adjustments |
| Monthly | Costs, productivity, and business objectives | Management priorities and improvement projects |
| Quarterly | Strategic performance and long-term trends | Investments, capacity, and business direction |
Each review should focus on three questions:
- What is happening?
- Why is it happening?
- What are we going to do about it?
The meeting should finish with clear actions, responsible owners, and follow-up dates.
For more practical guidance, see our article on How Daily Performance Meetings Improve Operational Results.
10. Common Barriers to Data-Driven Decisions
Even businesses with extensive reporting systems can struggle to use data effectively.
Several common barriers should be addressed.
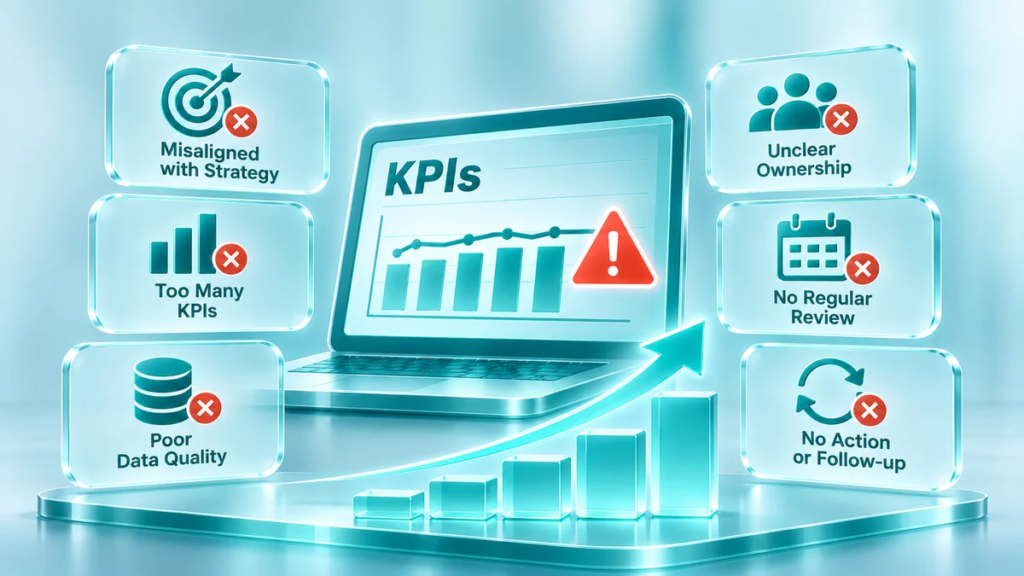
Too many KPIs
When everything is measured, priorities become unclear. Focus on indicators linked to business objectives.
Unclear KPI definitions
Different teams may use different calculations for the same measure. Establish standard definitions and data ownership.
Poor data quality
Incorrect, incomplete, or outdated information can lead to poor decisions. Validate data before relying on it.
Reporting without action
Reviewing dashboards without assigning actions creates little operational value.
Decisions based only on numbers
Data provides evidence, but managers should also consider operational knowledge, employee feedback, customer needs, and business context.
No follow-up
Without measuring the impact of decisions, businesses cannot establish whether improvements are sustainable.
Conclusion: Turn Information into Action
Operational data becomes valuable when it improves the quality of business decisions.
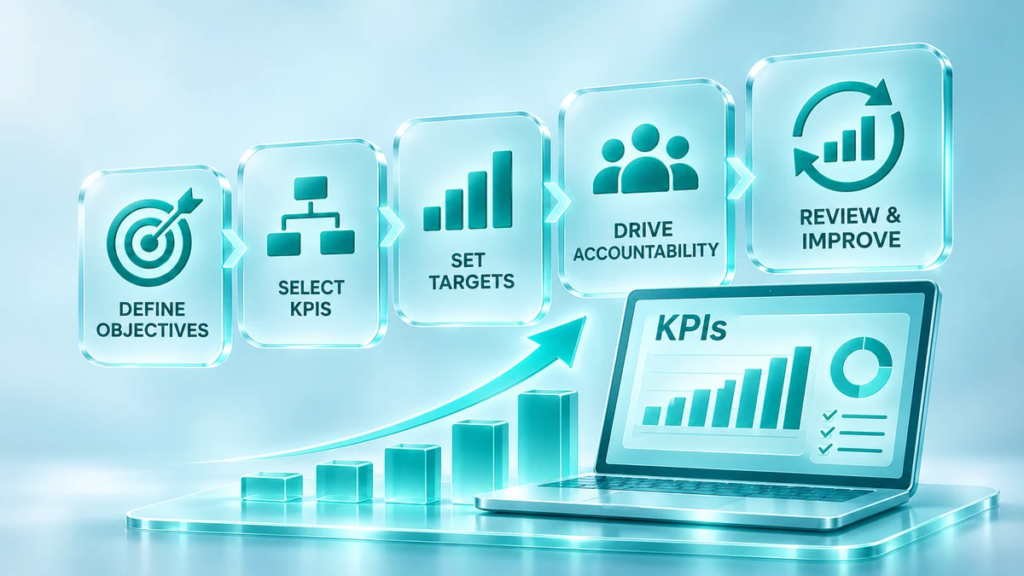
The process starts with clear business questions, reliable data, and relevant KPIs. Managers then compare results with targets, investigate the reasons behind deviations, agree on actions, and measure the impact.
Power BI and other business intelligence tools make performance information easier to access and analyse. But technology alone does not create a data-driven organisation.
The real difference comes from a management approach where information supports decisions, responsibilities are clear, and improvement actions are followed through.
The goal is not to collect more data. It is to make better decisions and achieve better business results.
How TOP KPI Can Help
TOP KPI helps organisations connect operational data with practical management decisions and measurable performance improvements.
Our services include:
- AUDIT – identify operational inefficiencies and performance gaps.
- DATA – structure operational data and establish reliable performance measurement.
- POWER BI – develop dashboards that make KPIs and operational results visible.
- ADVISORY – support management teams with performance reviews and improvement decisions.
- IMPLEMENTATION – turn analysis into practical operational improvements.
Explore our DATA services and POWER BI solutions to see how better use of operational data can support better business decisions.